Avoid complicated, expensive & unfocused tools - Install LOGROBOT specifically to Generate Reliable Notification Alerts on an unlimited number of log files on as many UNIX hosts & servers as is necessary!

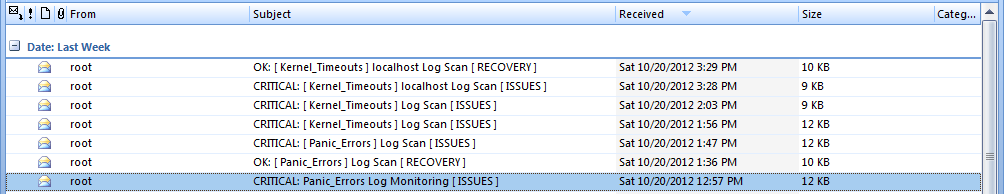
Screenshots for Nagios Users:  Set up notification alerts on all log files - Monitor time stamps, log contents & size, Alert if log file suddenly no longer exists (if deleted or not created), Alert if log lacks proper permissions...etc


Increase awareness to network infrastructure problems with fast detection of outages, Generate actionable alerts on Application specific issues / events, Database errors, System problems, Abnormal log behavior and more!

    Monitor-Log-File-for-Expected-Entries.png    https://web.archive.org/web/20140116221606/http://www.logrobot.com/Detailed-Log-Notifications.png    https://web.archive.org/web/20140116221207/http://www.logrobot.com/strings-not-found.png

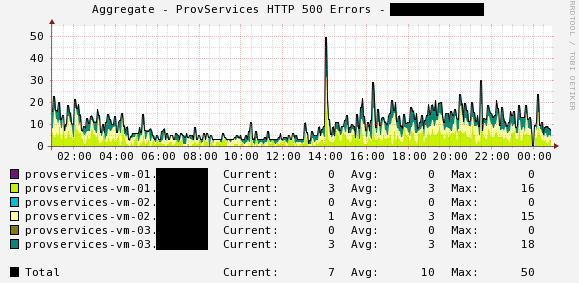
Screenshots for Cacti Users:  Graph & Beautify your log file activities - Visually inspect the graphs of all your monitored logs - Easily identify Rises & Drops in the frequency of entries


For these particular graphs, LOGROBOT scans a unique log file every 5 minutes.  The log file is written to by an application several times a minute. LOGROBOT scrapes the log at five minute intervals and then pulls out all information written to it within that time frame.  From the 5 minute worth of data retrieved after scanning, LOGROBOT graphs the number of lines it finds that contains "hostname.*SUCCESS" or "hostname.*FAILURE" ("hostname" = name of a server).  The GREEN graph show the number of lines found containing "hostname.*SUCCESS".  The RED graph show the Failures.  The middle graph shows an Aggregate of both graphs.


Scan / Monitor log files for user-defined entries & EXCLUDE specific lines from the results

Case Scenario:

Within the last 30 minutes, find out how many lines in the log file [ /var/log/app.log ] contain both entries of "ERROR" and "Client". If any lines are found containing these two strings (ERROR.*Client), take note of that.

From the list of lines found, see if there are any lines that also contain the keywords "error 404" OR "updateNumber".  If there are, remove them from the list.  After removing them, show me what is left.  If the number of lines left is between 5 and 9, alert as WARNING.  If equal to or over 10, alert as CRITICAL.  If below 5, do not alert!

Command:

logrobot  autofig  /var/log/app.log  30  ‘ERROR.*Client’  '(error 404|updateNumber)'  5  10  -show


Monitor log files for certain entries - ALERT IF those entries are NOT found 

Case Scenario:

For instance, within the last 30 minutes, if LOGROBOT does not find at least 2 lines containing the words "Success" and "Client"  and "returned 200" OR "update:OK" in the log file, it must alert.  So in other words, the lines to search for MUST contain both words of Success & Client (Success.*Client) AND one or both of the strings returned 200 and update:OK.

Command:

logrobot  autofig  /var/log/app.log  30  ‘SUCCESS.*Client’  '(returned 200|update:OK)'   2  2  -notfoundn


Scan Log files for specific entries & display results to the screen


This is particularly helpful in cases where you might want to see the actual lines that contain the patterns you instructed the tool to search for.


Example:

logrobot  autofig  /var/log/app.log  30  ‘ERROR.*Client’  '(error 404|updateNumber:OK)'  5  10  -show


Example:

logrobot  autofig  /var/log/app.log  30  ‘SUCCESS.*Client’  '(returned 200|update:OK)'   5  10  -show


Scan log files for minutes, hours, days, weeks or months worth of data


For instance, to pull out 2 weeks of information from within a large log file and to find out how many lines contain certain strings and patterns, you can run a command similar to this:


Example:

logrobot  autofig  /var/log/app.log  2w  ‘ERROR|error|panic|fail’  ‘ERROR|error|panic|fail’  5  10  -foundn


Notice the [ 2w ].  And also, notice the strings being searched for.  I repeated the strings ‘ERROR|error|panic|fail’ twice because there is no need to specify different search terms to look for.  You don't have to repeat the first string.  You can just enter a dot in its place for the second string..i.e:


logrobot  autofig  /var/log/app.log  2w  ‘ERROR|error|panic|fail’  ‘.’  5  10  -foundn


From this specific example, I'm telling LOGROBOT that I care about EVERY single line that contains any of the keywords I provided.  The [ 2w ] of course means 2 weeks. 


See below for the different ways of specifying the date range:


5m = 5 minutes (changeable to any number of minutes)

10h = 10 hours (changeable to any number of hours)

2d = 2 days (changeable to any number of days)

2w = 2 weeks (changeable to any number of weeks)

3mo = 3 months (changeable to any number of months)


Suppose you inherited a UNIX environment at your new job and don't know what to search for in the logs, here's an idea; instead of worrying about what to watch for, why not force the logs to reveal their hidden contents?


In the example below, LOGROBOT was instructed to search the entire messages file (denoted with the '.').  Then, it is to ignore every line that contains any one of these specific strings: 'nagios-primary nagios' OR 'not responding' OR 'synchronized to'.  Whatever lines are left after these THREE patterns are ignored should be outputted to the screen.  The logic here is; if you can identify which entries in the logs are of NO importance to you, you can exclude them from being monitored.  Therefore, if a log file is stripped of the familiar/unwanted, whatever is left will be unfamiliar, thus requiring investigation.
 
[root@nagios-primary ~]# logrobot sanal /var/log/messages 24h '.' 'nagios-primary nagios|not responding|synchronized to' 1 5 -showexcl

Jun 13 13:40:04 nagios-primary abrt[8269]: saved core dump of pid 8128 (/prod/nagios-core/sbin/status.cgi)
Jun 13 13:40:04 nagios-primary abrtd: Directory 'ccpp-2012-06-13-13:40:04-8128' creation detected
Jun 13 13:40:04 nagios-primary abrtd: Executable '/prod/nagios-core/sbin/status.cgi' doesn't belong to any
Jun 13 13:40:04 nagios-primary abrtd: Corrupted or bad dump /var/spool/abrt/ccpp-2012-06-13-13:40:04
Jun 14 02:20:41 nagios-primary auditd[5813]: Audit daemon rotating log files

2---0---(93)-(41064)-(0.226476%)-(28.4323)-(422.97)---ATWFILF---(Jun/13)-(13:23)---(Jun/14)-(13:23:26)


General LOGROBOT Syntax:

/bin/logrobot    autofig   (logfile)    (time-in-minutes)    '(string1)'    '(string2)'    (warn)    (critical)    (-foundn)

Basic Usage: 

[root@monitor jbowman]#
[root@monitor jbowman]#
[root@monitor jbowman]# logrobot autofig /var/log/messages 1440 'ntpd' 'stratum' 5 10 -foundn
 

2---240---108---ATWFILF---(Apr/13)-(03:35)---(Apr/14)-(03:35:23)


[root@monitor jbowman]#
[root@monitor jbowman]#

So now lets break this down:

logrobot is the tool name.

autofig is an option that is passed to the logrobot tool to tell it what to do.  In this particular case, autofig is instructing logrobot to "automatically figure out" what type of log file /var/log/messages is, and if the format of the log file is supported, perform the remaining functions.

/var/log/messages is of course the log file.

1440 is the amount of previous minutes you want to search the log file for. 1440 = last 24 hours.

"ntpd" is one of the strings that is in the lines of logs that you're interested in.

"stratum" is another string on the same line that you expect to find the "ntpd" string on. Specifying these two strings (luance and Err1310) isolates and processes the lines you want a lot quicker, particularly if you're dealing with a huge log file.

5 specifies Warning. By specifying 5, you're telling the program to alert as WARNING if there are at least 5 occurrences of the search strings you specified, in the log file within the last 60 minutes.

10 specifies Critical. By specifying 10, you're telling the program to alert as CRITICAL if there are at least 10 occurrences of the search strings you specified, in the log file within the last 60 minutes.

-foundn specifies what type of response you'll get. By specifying -foundn, you're saying if anything is found that matches the specified strings within the 60 minute time frame, then that should be regarded as a problem and outputted out.

Summarized Explanation:

As you can see, the logrobot tool is monitoring a log file. The arguments that are passed to the tool instructs it to do the following:

Within the last 60 minutes, if the tool finds less than 5 occurrences of the specified strings in the log file, DO NOT alert. If the tool finds between 5 to 9 occurrences of the specified strings in the log, it'll alert with a WARNING. If the tool discovers 10 or more instances of the strings in the log within the last 60 minutes, it'll alert with a CRITICAL.

Now, let us look at the result of the command:

2---240---108---ATWFILF---(Apr/13)-(03:35)---(Apr/14)-(03:35:23)

There are 6 columns which are separated by 3 hyphens (---).  The first column shows the exit code of the command you just ran.  0 means all is well. 1 means WARNING, which means, LOGROBOT discovered conditions that fell under the WARNING specification you provided.  2 means CRITICAL, which means, the worst case scenario has been reached.

In this particular example, here's what the output is telling us: 

You requested to have the /var/log/messages file scanned as far back as 24 hours ago (1440 minutes).

The timeframe that was scanned was from [ April 13, 03:35 ] to [ April 14, 03:35 ].  After scanning through the records that were written to the log in that time frame, LOGROBOT found 108 lines that contained both strings of "ntpd" and "stratum 2".  Also, as an FYI, the last date and time those specific strings were found in the log file was 240 seconds ago.


Monitor Any Log regardless of log format:


Alert if a specific pattern is found in a log file. In the alert, show offending/matching log lines:


Command:

NagiosLogMonitor hostA logrobot autonda /var/log/syslog 60m 'kernel|panic' '.' 3 5 syslog_check -ndshow
 

Explanation:


  1. Monitor the /var/log/syslog file
  2. The log file to monitor is /var/log/syslog file
  3. Monitor this log for any line containing "kernel" or "panic".
    • Indicated with the 'kernel|panic'  and  '.'
  4. If the number of lines found is less than 3, exit with an OK
  5. If the number of lines found is greater than or equal to 3, and less than 5, exit with a WARNING
  6. If the number of lines found is greater than or equal to 5, exit with a CRITICAL
  7. The name of this log check is syslog_check
  8. Whenever lines are found in the log containing the specified strings, we want to see those lines.
    • Indicated with the -ndshow
  9. While trying to scan this log file, if it is detected that the timestamp of the log itself is older than 60 minutes, abort!


Taking simplicity to a New level:

Instead of forcing users to have to read complex documentations, LOGROBOT provides real life examples of its usage right from the command line. Yes, REAL LIFE EXAMPLES! No guessing, no confusion, no scratching of the head. We strongly believe in simplicity and we take the extra steps many utilities refuse to take.

In the below output, let's say you forgot how to use the LOGROBOT tool. Instead of having to find the documentation and then having to read it as well, you can just run the the tool from the command line and pass to it the option you're interested in...i.e. autofig (or you can type 'auto' to get more information on other available features).

Example:

[root@nagios-primary ~]#  ./logrobot  autofig

----------------------------------------------------------------------------------------------------------------------------------------------
----------------------------------------------------------------------------------------------------------------------------------------------

Scan log file for 30 minutes worth of information. Show all lines found containing 'ERROR'
----------------------------------------------------------------------------------------------------------------------------------------------
----------------------------------------------------------------------------------------------------------------------------------------------


EXAMPLE:

./logrobot  autofig  /var/log/messages  30m   'ERROR'   '.'   5  10  -show


----------------------------------------------------------------------------------------------------------------------------------------------
----------------------------------------------------------------------------------------------------------------------------------------------
----------------------------------------------------------------------------------------------------------------------------------------------


Who needs LOGROBOT?


Download LOGROBOT if you wish to:

  • Get Notified whenever specific strings, patterns or keywords occur in your logs

  • Get Notified when expected patterns of strings ARE NOT found within specific log files

  • Avoid writing several scripts of your own, or downloading amateur scripts off the net

  • Get Notified when unfamiliar lines are introduced into your system / application logs

  • Get alerts when critical log files stop getting written to after a specified period of time

  • Get Notified if a log file is moved, deleted or no longer exist where it should

  • Get Notified when a log file lacks the proper / expected permissions...i.e. read access

  • Generate alerts if your monitored log files begin to consume excess disk space

  • Utilize a reliable log monitor that is maintained regularly & used in production environments

  • Have a technical support team available to accommodate your log monitoring requirements

  • Outsource Log File Monitoring (if you prefer to have our support team take it over for you)

  • Monitor any log file (regardless of size) that lacks a consistent date and/or time format

  • Utilize an intuitive log monitoring tool that eliminates the need to maintain several configuration files

  • Implement a clean log monitoring solution that does not require installation of nonnative modules

  • Monitor multiple log files without the nuisance of complex time consuming configurations

  • Avoid having to read endless documentations or wasting time training staff on new tools

DOWNLOAD


More Features:


  1. Monitors database logs for any error (mysql/oracle/etc) - Get notified on issues quickly

  2. Monitors custom application Log Files on any Unix host, regardless of flavor

  3. Alerts on the size / disk usage of files on your UNIX hosts - Prevent log file(s) from taking up space

  4. Monitor timestamps of files (ensure specific logs are being updated regularly / frequently)

  5. Scan Log files by time frames (i.e. previous 20 minutes, 60 minutes,  1 day, 1 week etc) - Precise!

  6. Alert when expected record of events are NOT found in a log within a set period of time

  7. In-Depth Analysis: scan logs for instances of unusual entries - Easily Identify bizarre log content

  8. Monitor different log formats (including custom logs, not just the typical system files)

  9. Scan logs for specific entries and exclude a list of user specified patterns from the result

  10. Includes PHP Web Interface for viewing of log files on local and remote hosts

  11. Allows for monitoring of all log files, even Windows files (mounted through NFS on a UNIX server)

  12. Ability to specify multiple strings / patterns to watch for using Command line or Configs

  13. Identify & Inform users on how long ago a particular string/pattern/keyword was last found

  14. Remote Agent Included for the monitoring of logs on several hosts FROM ONE master

  15. Automatically figures out conditions on which to recover alerts, based on log content & other variables

  16. Simple, pluggable command-line parameters (no need for any confusing configuration files)

  17. Automatically detects log file type and format without user intervention

  18. Get notified via email of all events related to your log of choice on any server(s) you specify

  19. Updated / Upgraded regularly to meet new demands from various clients, different companies


Other Specific Features:

  • Scan / Scrape / Monitor log files for any error

  • Monitor all logs in a specific directory

    • Point logrobot to ANY directory with just one check!

      • Avoid having to define separate checks for each log file

    • Specify the type of files to exclude / include in monitoring

  • Automate log checks via Nagios or CRONTAB

  • Get email alerts & notifications on all log checks

  • Access documentation directly from the CLI

  • Monitor log files for abnormal behavior/activity

  • Manage log file checks from a central location

    • Eliminate tedious administration

    • Avoid cumbersome maintenances

  • Adapts seamlessly to any custom scenario


Supported Log Files

  • Will all my logs be supported?

    Yes, all log types / log formats are supported. 

    Some of the supported log files are listed below:

    • Tomcat Catalina.out logs

    • Apache Maxclient logs

    • Apache access logs

    • Apache error logs

    • OutOfMemory logs

    • JBoss log files

    • Java log files

    • Weblogic logs

    • Glassfish logs

    • Syslog log monitor

    • Maillog / Postfix / Syslog log files

    • Mysqld / Oracle Alert logs

    • Log4j

    • NEW FEATURE: Monitor any type of log file regardless of format
       

Back to Top


Monitor File Timestamps:


In the example below, the LOGROBOT tool is asked to check the timestamp of the /var/log/messages file.  If this file is not updated in 10 minutes, alert as WARNING.  If the file isn't updated in 20 minutes, alert as CRITICAL.  If the latest update time of the file is under 10 minutes, do not ALERT at all.  Just abort with a 0.  The '290' tells (in seconds) how long ago the file was last written to.


[root@monitor jbowman]#
[root@monitor jbowman]#
[root@monitor jbowman]# logrobot autodoc /var/log/messages 10 20 -timestamp
0:290
[root@monitor jbowman]#
[root@monitor jbowman]#


Monitor File Size:


In the next example below, LOGROBOT is being asked to monitor the size of the /var/log/messages file.  If the size of the file is between 60 and 120 megabytes, it will alert as WARNING.  If the size of the file is equal to or above 120 MB, it will alert as CRITICAL.  Of course, if the reported file size is below 60, there are no issues to alert on. It will just abort with a 0.  The 19:52 MB below denotes the current/latest size of the specified size.


[root@monitor jbowman]#
[root@monitor jbowman]#
[root@monitor jbowman]#

[root@monitor jbowman]# logrobot  autodoc  /var/log/messages  60  120  -filesize
0:19.52MB
[root@monitor jbowman]#
[root@monitor jbowman]#


Log Analysis:


Analyze Log Files Minute by Minute or Hour by Hour


If you wish to quickly identify, from your logs, what time period an issue occurred, logrobot can accomplish that for you effortlessly.  The options to use are "-exceldm" and "-exceldh".  These two options are designed specifically for minute by minute or hour by hour analysis.


EXAMPLE 1:


If you wanted to find out how many instances of your search patterns occurred each hour for the last 1 day, examine the below.  The very first line of the output here tells us there are 2551 instances of the occurrence "CRITICAL" at the 6:00 hour. This immediately tells us it was in the 6:00 hour something serious happened.


[root@nagios-master ]# logrobot  autofig  /var/log/messages  1d  'CRITICAL'  '.'  1  2  -exceldh


Graphing Log Files:


Example 1:

Using Cacti, a log file on 6 different servers is being graphed for 500 related errors

Each server below is tagged with a different color for easy identification:


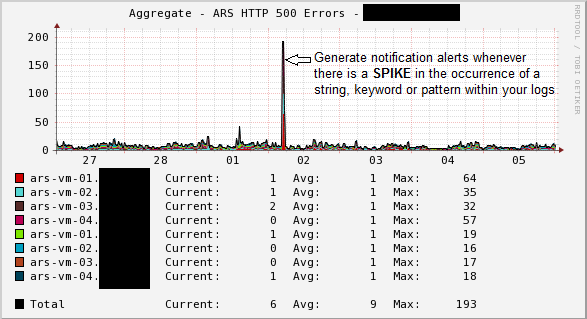
Example 2:

Using Cacti, a log file on 8 different servers is being graphed for 500 related errors

Each server below is tagged with a different color for easy identification:


Back to Top

Shown below are some of the many different ways LOGROBOT can be utilized to Scan Log files from the command line:


Artificial Log Intelligence - Instructing logs to reveal their hidden contents (by specifying a list of strings to ignore):


  • Scan the /var/log/messages log file for 24 hours worth of information.  Exclude all lines that contain 'nagios-primary nagios | not responding, timed out| synchronized to'

[root@nagios-primary ~]# logrobot  sanal  /var/log/messages  24h  '.'  'nagios-primary nagios|not responding, timed out| synchronized to'  1  5  -showexcl
 

Jun 13 13:40:04 nagios-primary abrt[8269]: saved core dump of pid 8128 (/prod/nagios-core/sbin/status.cgi) to /var/spool/abrt/ccpp-2012-06-13-13:40:04-8128.new/coredump (2490368 bytes)
Jun 13 13:40:04 nagios-primary abrtd: Directory 'ccpp-2012-06-13-13:40:04-8128' creation detected
Jun 13 13:40:04 nagios-primary abrtd: Executable '/prod/nagios-core/sbin/status.cgi' doesn't belong to any package
Jun 13 13:40:04 nagios-primary abrtd: Corrupted or bad dump /var/spool/abrt/ccpp-2012-06-13-13:40:04-8128 (res:2), deleting
Jun 14 02:20:41 nagios-primary auditd[5813]: Audit daemon rotating log files


2---0---(93)-(41064)-(0.226476%)-(28.4323)-(422.97)---ATWFILF---(Jun/13)-(13:23)---(Jun/14)-(13:23:26) ZEAGMK
 

[root@nagios-primary ~]#

[root@nagios-primary ~]#

[root@nagios-primary ~]#


  • Scan the /var/log/messages log file for 1 week's worth of information.  Show me all lines that contain the strings: 'nagios-primary abrtd:'

[root@nagios-primary ~]# logrobot sanal /var/log/messages 1w '.' 'nagios-primary abrtd:' 1 5 -show

Jun 10 19:45:34 nagios-primary abrtd: Directory 'ccpp-2012-06-10-19:45:34-19662' creation detected
Jun 10 19:45:35 nagios-primary abrtd: Executable '/prod/nagios-core/sbin/status.cgi' doesn't belong to any package
Jun 10 19:45:35 nagios-primary abrtd: Corrupted or bad dump /var/spool/abrt/ccpp-2012-06-10-19:45:34-19662 (res:2), deleting
Jun 12 07:07:03 nagios-primary abrtd: Directory 'ccpp-2012-06-12-07:07:02-30780' creation detected
Jun 12 07:07:03 nagios-primary abrtd: Executable '/prod/nagios-core/sbin/status.cgi' doesn't belong to any package
Jun 12 07:07:03 nagios-primary abrtd: Corrupted or bad dump /var/spool/abrt/ccpp-2012-06-12-07:07:02-30780 (res:2), deleting
Jun 13 13:40:04 nagios-primary abrtd: Directory 'ccpp-2012-06-13-13:40:04-8128' creation detected
Jun 13 13:40:04 nagios-primary abrtd: Executable '/prod/nagios-core/sbin/status.cgi' doesn't belong to any package
Jun 13 13:40:04 nagios-primary abrtd: Corrupted or bad dump /var/spool/abrt/ccpp-2012-06-13-13:40:04-8128 (res:2), deleting


2---81900---(9)-(176115)-(0.0051103%)-(3)-(0)---(Jun/7)-(13:27)---(Jun/14)-(13:27:26)---ETWNFILF---(Jun/10)-(03:37:03)---(Jun/14)-(13:27:26) NAGCGKiv
 

[root@nagios-primary ~]#

[root@nagios-primary ~]#

[root@nagios-primary ~]#

[root@nagios-primary ~]#


Show All entries logged in the [ kern.log ] log file within the last 2 HOURS:


root@nagios-primary ~#

root@nagios-primary ~#

root@nagios-primary ~#

root@nagios-primary ~# logrobot autofig /var/log/kern.log 2h '.' '.' 1 2 -show


Sep 20 17:55:06 jake-XPS-M1530 kernel: [87310.160050] usb 5-1: new full-speed USB device number 26 using uhci_hcd

Sep 20 17:55:06 jake-XPS-M1530 kernel: [87310.388215] hub 5-1:1.0: USB hub found

Sep 20 17:55:06 jake-XPS-M1530 kernel: [87310.390118] hub 5-1:1.0: 4 ports detected

Sep 20 17:55:06 jake-XPS-M1530 kernel: [87310.673128] usb 5-1.2: new low-speed USB device number 27 using uhci_hcd

Sep 20 17:55:06 jake-XPS-M1530 kernel: [87310.831895] input: Logitech USB Receiver as /devices/pci0000:00/0000:00:1d.0/usb5/5-1/5-1.2/5-1.2:1.0/input/input34

Sep 20 17:55:06 jake-XPS-M1530 kernel: [87310.832071] logitech 0003:046D:C517.001B: input,hidraw0: USB HID v1.10 Keyboard [Logitech USB Receiver] on usb-0000:00:1d.0-1.2/input0

Sep 20 17:55:06 jake-XPS-M1530 kernel: [87310.863133] logitech 0003:046D:C517.001C: fixing up Logitech keyboard report descriptor

Sep 20 17:55:06 jake-XPS-M1530 kernel: [87310.865367] input: Logitech USB Receiver as /devices/pci0000:00/0000:00:1d.0/usb5/5-1/5-1.2/5-1.2:1.1/input/input35

Sep 20 17:55:06 jake-XPS-M1530 kernel: [87310.865633] logitech 0003:046D:C517.001C: input,hiddev0,hidraw3: USB HID v1.10 Mouse [Logitech USB Receiver] on usb-0000:00:1d.0-1.2/input1

Sep 20 17:55:08 jake-XPS-M1530 kernel: [87312.249129] usb 5-1.3: new low-speed USB device number 28 using uhci_hcd

Sep 20 17:55:08 jake-XPS-M1530 kernel: [87312.436287] input: No brand 4 Port KVMSwicther as /devices/pci0000:00/0000:00:1d.0/usb5/5-1/5-1.3/5-1.3:1.0/input/input36

Sep 20 17:55:08 jake-XPS-M1530 kernel: [87312.436429] generic-usb 0003:10D5:55A4.001D: input,hidraw4: USB HID v1.10 Keyboard [No brand 4 Port KVMSwicther] on usb-0000:00:1d.0-1.3/input0

Sep 20 17:55:08 jake-XPS-M1530 kernel: [87312.442165] usbhid 5-1.3:1.1: couldn't find an input interrupt endpoint


2---3240---13---(Sep/20)-(16:49)---(Sep/20)-(17:55:08)---ETWNFILF---(Sep/20)-(17:55)---(Sep/20)-(17:55:08) NAGC


root@nagios-primary ~#

root@nagios-primary ~#

root@nagios-primary ~#


Scan through the above output and show ONLY lines that contain the strings "USB HID":


root@nagios-primary ~#

root@nagios-primary ~#

root@nagios-primary ~#

root@nagios-primary ~# logrobot autofig /var/log/kern.log 2h '.' 'USB HID' 1 2 -show


Sep 20 17:55:06 jake-XPS-M1530 kernel: [87310.832071] logitech 0003:046D:C517.001B: input,hidraw0: USB HID v1.10 Keyboard [Logitech USB Receiver] on usb-0000:00:1d.0-1.2/input0

Sep 20 17:55:06 jake-XPS-M1530 kernel: [87310.865633] logitech 0003:046D:C517.001C: input,hiddev0,hidraw3: USB HID v1.10 Mouse [Logitech USB Receiver] on usb-0000:00:1d.0-1.2/input1

Sep 20 17:55:08 jake-XPS-M1530 kernel: [87312.436429] generic-usb 0003:10D5:55A4.001D: input,hidraw4: USB HID v1.10 Keyboard [No brand 4 Port KVMSwicther] on usb-0000:00:1d.0-1.3/input0


2---3420---3---(Sep/20)-(16:52)---(Sep/20)-(17:55:08)---ETWNFILF---(Sep/20)-(17:55)---(Sep/20)-(17:55:08) NAGC


root@nagios-primary ~#

root@nagios-primary ~#

root@nagios-primary ~#

root@nagios-primary ~#


Search through the [ kern.log ] file. Find out which HOUR within the last 8 hours had the most entries logged:


root@nagios-primary ~#

root@nagios-primary ~#

root@nagios-primary ~#

root@nagios-primary ~#

root@nagios-primary ~# logrobot sanal /var/log/kern.log 8h '.' '.' 1 2 -exceldh


frq=19,zsc=1.41421,asc=[Sep-20-(16)]

frq=13,zsc=-0.707106,asc=[Sep-20-(17)]

frq=13,zsc=-0.707106,asc=[Sep-20-(15)]


root@nagios-primary ~#

root@nagios-primary ~#

root@nagios-primary ~#

root@nagios-primary ~#


Search through the [ kern.log ] file once again. Find out which MINUTE(S) within the last 8 hours had the most entries logged:


root@nagios-primary ~#

root@nagios-primary ~#

root@nagios-primary ~#

root@nagios-primary ~# logrobot sanal /var/log/kern.log 8h '.' '.' 1 2 -exceldm


frq=13,zsc=0.816496,asc=[Sep-20-(17:55)]

frq=13,zsc=0.816496,asc=[Sep-20-(16:16)]

frq=13,zsc=0.816496,asc=[Sep-20-(15:31)]

frq=3,zsc=-1.22474,asc=[Sep-20-(16:24)]

frq=3,zsc=-1.22474,asc=[Sep-20-(16:15)]


root@nagios-primary ~#

root@nagios-primary ~#

root@nagios-primary ~#

root@nagios-primary ~#

root@nagios-primary ~#

root@nagios-primary ~#

root@nagios-primary ~#


Show once again All entries recorded in the [ kern.log ] log file within the last 2 HOURS:


root@nagios-primary ~#

root@nagios-primary ~#

root@nagios-primary ~#

root@nagios-primary ~# logrobot autofig /var/log/kern.log 2h '.' '.' 1 2 -show


Sep 20 17:55:06 jake-XPS-M1530 kernel: [87310.160050] usb 5-1: new full-speed USB device number 26 using uhci_hcd

Sep 20 17:55:06 jake-XPS-M1530 kernel: [87310.388215] hub 5-1:1.0: USB hub found

Sep 20 17:55:06 jake-XPS-M1530 kernel: [87310.390118] hub 5-1:1.0: 4 ports detected

Sep 20 17:55:06 jake-XPS-M1530 kernel: [87310.673128] usb 5-1.2: new low-speed USB device number 27 using uhci_hcd

Sep 20 17:55:06 jake-XPS-M1530 kernel: [87310.831895] input: Logitech USB Receiver as /devices/pci0000:00/0000:00:1d.0/usb5/5-1/5-1.2/5-1.2:1.0/input/input34

Sep 20 17:55:06 jake-XPS-M1530 kernel: [87310.832071] logitech 0003:046D:C517.001B: input,hidraw0: USB HID v1.10 Keyboard [Logitech USB Receiver] on usb-0000:00:1d.0-1.2/input0

Sep 20 17:55:06 jake-XPS-M1530 kernel: [87310.863133] logitech 0003:046D:C517.001C: fixing up Logitech keyboard report descriptor

Sep 20 17:55:06 jake-XPS-M1530 kernel: [87310.865367] input: Logitech USB Receiver as /devices/pci0000:00/0000:00:1d.0/usb5/5-1/5-1.2/5-1.2:1.1/input/input35

Sep 20 17:55:06 jake-XPS-M1530 kernel: [87310.865633] logitech 0003:046D:C517.001C: input,hiddev0,hidraw3: USB HID v1.10 Mouse [Logitech USB Receiver] on usb-0000:00:1d.0-1.2/input1

Sep 20 17:55:08 jake-XPS-M1530 kernel: [87312.249129] usb 5-1.3: new low-speed USB device number 28 using uhci_hcd

Sep 20 17:55:08 jake-XPS-M1530 kernel: [87312.436287] input: No brand 4 Port KVMSwicther as /devices/pci0000:00/0000:00:1d.0/usb5/5-1/5-1.3/5-1.3:1.0/input/input36

Sep 20 17:55:08 jake-XPS-M1530 kernel: [87312.436429] generic-usb 0003:10D5:55A4.001D: input,hidraw4: USB HID v1.10 Keyboard [No brand 4 Port KVMSwicther] on usb-0000:00:1d.0-1.3/input0

Sep 20 17:55:08 jake-XPS-M1530 kernel: [87312.442165] usbhid 5-1.3:1.1: couldn't find an input interrupt endpoint


2---3960---13---(Sep/20)-(17:01)---(Sep/20)-(17:55:08)---ETWNFILF---(Sep/20)-(17:55)---(Sep/20)-(17:55:08) NAGC


root@nagios-primary ~#

root@nagios-primary ~#

root@nagios-primary ~#

root@nagios-primary ~#


From the above output, exclude all lines that contain 'Logitech' and show me what is left:


root@nagios-primary ~#

root@nagios-primary ~#

root@nagios-primary ~#

root@nagios-primary ~#

root@nagios-primary ~# logrobot sanal /var/log/kern.log 2h '.' 'Logitech' 1 2 -showexcl


Sep 20 17:55:06 jake-XPS-M1530 kernel: [87310.160050] usb 5-1: new full-speed USB device number 26 using uhci_hcd

Sep 20 17:55:06 jake-XPS-M1530 kernel: [87310.388215] hub 5-1:1.0: USB hub found

Sep 20 17:55:06 jake-XPS-M1530 kernel: [87310.390118] hub 5-1:1.0: 4 ports detected

Sep 20 17:55:06 jake-XPS-M1530 kernel: [87310.673128] usb 5-1.2: new low-speed USB device number 27 using uhci_hcd

Sep 20 17:55:08 jake-XPS-M1530 kernel: [87312.249129] usb 5-1.3: new low-speed USB device number 28 using uhci_hcd

Sep 20 17:55:08 jake-XPS-M1530 kernel: [87312.436287] input: No brand 4 Port KVMSwicther as /devices/pci0000:00/0000:00:1d.0/usb5/5-1/5-1.3/5-1.3:1.0/input/input36

Sep 20 17:55:08 jake-XPS-M1530 kernel: [87312.436429] generic-usb 0003:10D5:55A4.001D: input,hidraw4: USB HID v1.10 Keyboard [No brand 4 Port KVMSwicther] on usb-0000:00:1d.0-1.3/input0

Sep 20 17:55:08 jake-XPS-M1530 kernel: [87312.442165] usbhid 5-1.3:1.1: couldn't find an input interrupt endpoint


2---4320---(8)-(13)-(61.5385%)-(8)-(0)-(frq=8,zsc=0,asc=[Sep-20-(17:55)])---(Sep/20)-(17:07)---(Sep/20)-(17:55:08)---ETWNFILF---(Sep/20)-(17:55)---(Sep/20)-(17:55:08) NAGCzzmm


root@nagios-primary ~#

root@nagios-primary ~#

root@nagios-primary ~#

root@nagios-primary ~#


Back to Top

Logchecks via Emails


To Receive EMAIL Notifications on log files, run this command (you can also place command in CRON for automated scheduling of log checks):


root@nagios-primary ~# LogRobotEmailer localhost logrobot autofig /var/log/messages 5h 'kernel' 'timed out' 1 2 -show Kernel_Timeouts Support@Logrobot.com

root@nagios-primary ~#

root@nagios-primary ~#

root@nagios-primary ~#

root@nagios-primary ~#


  • The name given to this particular log check is "Kernel_Timeouts".  The subject of the email alerts you receive will be similar to any of these:


  • CRITICAL:  [ Kernel_Timeouts ] localhost Log Scan [ ISSUES ].


  • WARNING:  [ Kernel_Timeouts ] localhost Log Scan [ ISSUES ].


  • OK:  [ Kernel_Timeouts ] localhost Log Scan [ RECOVERY ].


Advanced monitoring of Log Files


What is a Log File Monitor?

A log file monitor is a utility designed and built specifically to monitor and alert on messages produced by computer systems and the applications that run on them.

In UNIX, the monitoring of log files is absolutely necessary, and for good reason. You see, the time of a Unix Professional is valuable. Few, if any, can afford to spend hours each day scouring through the many log files that are generated by systems and network applications. However, if you fail to quickly recognize the abnormal or fatal events chronicled in these log files, entire networks can be abused and/or removed from service....which can cost your company dearly, monetarily speaking.

If you wish to monitor log files, there are basically [ 3 ] options available to you:

  1. You can try writing your own log monitoring script and see how far that takes you (this is worth looking into if you only have a couple of logs to monitor)

  2. Download any of the FREE log monitoring scripts that are available all over the internet OR

  3. Purchase a professional tool that was developed specifically for situations like yours and that can easily accommodate future customizations, if necessary

If you embark on a journey to write your own script, you have to understand that it will be an endeavor that will take years to complete, and that's assuming you're a skilled programmer.  Monitoring log files goes far beyond simply watching the contents of files for specific errors.  As time goes on, there will be new requirements, changes, and continuous requests for modifications which in the end, if the developer isn't creative, can lead to an unusable script - one that is not user friendly.

If you choose to download the FREE log monitoring scripts that are available on the internet, you will quickly discover how ineffective they all are and how much work is necessary to get them to cooperate.  If this is the option you choose to go with, you must ask yourself some very important questions:

  • Will I be able to easily administer the creation and modification of several log checks (from a central location) using this method?

  • Is this method scalable? 

    • Can I use this one method to monitor different logs on several hundred servers, or am I going to have to do a lot of configurations, compilations, installations, tweaking etc?

The answers to these questions are usually depressing.  Proceed with caution.


Characteristics of the Ideal Log Monitor:

When searching for the right utility to use to monitor & alert on log files, what features should the perfect tool have?

The ideal log monitor must be able to scan and monitor log files in a very short period of time, preferably in seconds (no matter how big the log file is). At the very least, the perfect log monitor must be able to:

  • Detect abnormal usage patterns in log files

  • Recognize system or network abuse (through mathematical analysis of data)

  • Detect vulnerability scans (e.g. port scans) through the use of user-specified patterns

  • Detect intruders or attempted intrusions (through the use of user-specified patterns)

  • Detect resource shortages (e.g. slow response times, out-of-memory conditions etc)

  • Detect imminent application and system failures (this is usually in some log file on your system)

  • Scan, monitor & alert on log files of different formats (this is absolutely crucial)

While each feature listed here is important, it is worth noting that above all else, the perfect log monitoring utility must be easy to use. Users SHOULD NEVER have to spend too much time reading documentations before being able to utilize a software.  The more complex a utility is, the more likely it is to be used the wrong way or abandoned altogether.  Imagine having to re-read the Instruction Guide of your Television remote control each time you wanted to use it. Can you picture the annoyance of that?

When it comes to log monitoring, ease of use is essential.  I cannot stress this enough. The developer(s) must focus a great deal of effort into drastically limiting or even eliminating the need for configuration files. Also, the syntax of the tool must be easily comprehensible and applicable directly from the command line. This means, if a random user were to run the tool from the command line, there shouldn’t be room for confusion. That user should be able to conveniently obtain whichever end result he/she was expecting WITHOUT having to read several pages of complex documentations.

This is where the superiority of LOGROBOT comes into play.  LOGROBOT (also known as logXray) is a commercial Log Monitoring utility that is very easy to utilize.  It is robust, seasoned and efficiently versatile like no other tool.  It understands the overriding significance of log alerting and focuses on ensuring only valid alarms are generated for the log files it monitors.  Installation wise, LOGROBOT does not require the addition of any nonnative modules or libraries to the system.  Which means, you can install it freely on production servers without tampering with existing libraries or modules.

LOGROBOT has a wide range of capabilities. It isn't limited to only scanning log file contents for errors.  It can do virtually anything as long as it falls under the banner of log monitoring.  Additionally, LOGROBOT has years of real life situations, possibilities and conditions built into it, which basically means it is highly unlikely you will come up with a need that hasn't already been thought of and programmed into the tool.  In the unlikely event that does happen, chances are, work is already in progress to address it.

When it comes to keeping an unwavering eye on all important log files in your UNIX environment, you need ONE log monitoring tool, and LOGROBOT is that tool!


Back to Top

Configuring Logrobot with Nagios (if you have Nagios)


Your [ commands.cfg file ] will contain:

define command {
                            command_name         NagiosLogMonitor
                            command_line            $USER1$/NagiosLogMonitor $HOSTNAME$ $ARG1$ $ARG2$ $ARG3$ $ARG4$ '$ARG5$' '$ARG6$' $ARG7$ $ARG8$ $ARG9$ $ARG10$
}


OR


define command {
                            command_name         NagiosLogMonitor
                            command_line            $USER1$/NagiosLogMonitor $HOSTADDRESS$ $ARG1$ $ARG2$ $ARG3$ $ARG4$ '$ARG5$' '$ARG6$' $ARG7$ $ARG8$ $ARG9$ $ARG10$
}


Your [ services.cfg file ] will look similar to:

define service {
                      check_command                         NagiosLogMonitor!logrobot!autofig!/var/log/proteus.log!15!500.html!500 Internal Server Error!1!2!-foundn
                      max_check_attempts                  1
                      service_description                     500_ERRORS_LOGCHECK
                      host_name                                  logrobot-01.net,logrobot-02.net,logrobot-03.net
                      use                                              fifteen-minute-interval
 }
 

Back to Top


After the above configuration is completed, follow the instructions below:

  1. Copy (scp) the LOGROBOT package file to each one of the remote hosts (in the above example, I would have to copy it to each one of the hosts specified for "host_name")

  2. When the LOGROBOT package file has been copied over to the remote hosts, unzip it, then run the install script on each of the hosts:

  •  unzip LOGROBOT.zip 

  •  [  ./InstallAgent.sh     /apps/magent     5666     10.20.30.40     client   ]   --- Change the port to an open TCP port, change the IP to match the IP of the Master server.

  1. On the master server, (the server on which Nagios is installed, and from which you plan on monitoring all your log files), run this:

  •  unzip LOGROBOT.zip 

  •  [  ./InstallAgent.sh     /apps/magent     5666     10.20.30.40     master   ]   --- Change the port to an open TCP port, change IP to match the IP of the Master server.


To test that everything works as it should, on the master host, run the following command (change the parameters as needed):

  •  ./NagiosLogMonitor    logrobot-01.net    logrobot    autofig    /var/log/proteus.log   15m   '500.html'   '500 Internal Server Error'   2   3  -show 


What's going on with the above command?

I'm basically telling Nagios to:

  • monitor the log file named /var/log/proteus.log on the remote host logrobot-01.net

  • scan the last 15 minutes of information of the log file - in other words, pull out 15 minutes worth of information/lines

  • from the 15 minutes worth of information, alert as Warning if at least 2 lines (but less than 3 lines) are found that contain 500.html and 500 Internal Server Error'.

  • from the last 15 minutes of information, alert as Critical ONLY if 3 or more lines are found that contain 500.html and 500 Internal Server Error'.

  • alert as OK if less than 2 lines are found in the log file matching the specified strings / patterns

  • if an error is found in the log, keep alerting until a time period of at least 15 minutes has passed WITHOUT any new problem lines added to the log

  • the "-show" will show you the actual lines from the log that triggered the alert.

  • the "autofig" will automatically determine the type of log you have


Sample Screenshot


Back to Top

Professional Consultation for Log File Monitoring


If you prefer to have us set up log monitoring checks for you on all UNIX systems in your environment, contact us for a quote.


The complete log monitoring setup will include:

  • Automated installation of the latest FREE version of the NAGIOS CORE Application on any host you wish to have it on (must be running Linux)

    • Default Nagios Plugins are included with the Install

  • Automated Installation of the latest FREE version of the Cacti Graphing Application on any host of your choice (must also be running Linux)

    • Plugins will be included with the install - which means, you won't have to worry about learning how to install them

  • Log monitoring for any log file you wish to monitor, as long as it resides on a UNIX system, or on an NFS drive

    • Customized log checks - If you wish to have a specific type of log file monitored in a specific way, this too, can be accommodated.

  • Generate Microsoft Excel Reports on the alert history of your log checks (if using Nagios)

  • 24 / 7 Support for the maintenance of the configured log checks

    • Maintenance Involves:

      • Requests for customized development of company / application specific features

      • Frequent updates and/or upgrades to the latest version of LOGROBOT, whenever available


Reasons for Professional Consultation


Professional consultation (or outsourcing) is NOT necessary in most cases.  This is because both the installation of LOGROBOT and its day to day usage are easy to understand.  You DO NOT have to be an experienced UNIX user to get this log monitoring tool up and running.  We've already done all the hard work to make sure of that.  You only need to follow the basic instructions provided.  The few commands you will need to run are simplistic in nature and do not require any technical sophistication.  This means, unlike other tools, there isn't a lengthy complicated manual for you to read up on.  All the complex steps you would have had to carry out yourself have already been programmed into the LOGROBOT tool.  All you have to do is run it.

While professional consultation may not be necessary in most cases, there is a variety of reasons some may still wish to delegate the task of monitoring logs to an outside entity.  Whatever the reasons may be, if you need help configuring log checks on any of your UNIX hosts, the LOGROBOT support team will handle it for you.  We are specialized in this particular area and have in our arsenal an enormous collection of automated tools to help execute, on a large scale, a wide range of tasks.  If this option is of interest to you, Contact Us.


Back to Top

Frequently Asked Questions

What exactly can I do with LOGROBOT?

  1. Monitor & Alert on the contents of UNIX System Log Files (errors, strings, keywords, patterns etc)

  2. Monitor & Alert on custom Application log files (mysql, oracle, apache/http and much more)

  3. Monitor logs and alert if certain keywords, patterns ARE NOT found within a specific timeframe

  4. Monitor & Alert on the timestamps of log files (verify files are being updated regularly)

  5. Monitor several log files at the same time - (very useful if you have multiple logs to scan for errors)

  6. In addition to monitoring a live log, it can also monitor rotated logs to ensure all errors are caught

  7. Graph the frequency with which user-specified strings occur in log files - Or graph for anomalies

  8. Monitor & Alert on the file size of logs (ensure files do not consume too much disk space)

  9. Monitor log files, no matter how big they are (even log files that are GIGABYTES in size)

  10. View logs on all your servers from one Web Interface (avoid having to ssh to each host)

  11. Analysis - Easily identify which minute or hour of the day had the most entries recorded


Is it easy to install LOGROBOT?

Absolutely!

With LOGROBOT, there's very little you have to do.  Most UNIX tools often force users to manually edit configuration files, perform complex compilations and install packages or libraries that are unnatural to the UNIX system. 

With LOGROBOT, there is no need for that. All the manual work you would have had to do has already been automated and hard-coded into the installation script ( InstallAgent.sh ).  Which means, all you have to do, after downloading the LOGROBOT zip file, is to just run one simple command and everything will be automatically set up in place for you.


In what other ways can LOGROBOT be used to scan, monitor and alert on log files:

There are many different ways in which LOGROBOT can be used to monitor log files.


For example:

  • How many 404s were reported in this apache log file within the last 60 minutes, etc,

  • How many logins were made by this user from IPs x, y, and z within the last 15 minutes

  • How many mails were sent by this user userA within the last day

  • How many mails were received by that other user named userB within the last 30 minutes

  • How many failed ssh attempts were made from these set of IPs within the last 10 minutes

  • How many times did this specific string occur in the log file within the last 10 minutes


How easy is it to setup log checks / log monitoring for log files?


It is very easy to setup logchecks through LOGROBOT. Most UNIX users dread having to read documentations.  This is understandable.  When we developed LOGROBOT, we took that into account because we understand where they're coming.  I am one of them and I share their disdain for unnecessary labor.


The LOGROBOT tool is designed in such a way that allows it to handle, by itself, all the several little steps other tools would have had you do yourself...i.e. compilations, editing a bazillion files, searching for ReadMe text files, having to read those text files, troubleshooting issues...etc.  This automated design eliminates the chances of a screw-up, and saves you from stressing over technical issues.


Some of my Logs do not have a date format.  Can LOGROBOT monitor these types of log files?

Yes! Just pass the “autonda” option to LOGROBOT, instead of autofig.  Matter of fact, you can try either one of those options to see which one you prefer.  “autonda” is much faster. 

"autonda" provides more robust information about the log you're monitoring. 

"autofig" can be used to perform analysis on logs that have a consistent date & time format.

To get familiar with all the options available in LOGROBOT, at the command line, simply type:

[root@nagios-master ]# ./logrobot  auto  (or you can type it with no arguments)


After Purchasing LOGROBOT will you assist me if I need any help?

Absolutely! Support is free. It is highly unlikely you'll need help setting up LOGROBOT.  The tool was deliberately designed and built to be simplistic in its setup.  However, if you find that you require some type of assistance, please do not hesitate to Contact Us.


Can you help me with the installation of Nagios and/or Cacti on my UNIX System(s)?

Absolutely! If you don't already have Nagios installed, but wish to have it, let us know. We have an automated utility in our arsenal that will install both applications for you, relieving you of the tedious responsibility of having to labor over complex configuration setups. Contact Us for more information.


How much is LOGROBOT?

LOGROBOT is currently $99.95.  See the table at the bottom of the page for other options.


Are the listed prices one-time payments, or are they monthly (reoccurring)?

All plans listed at the bottom of this page are one-time payments.


Is there a Money Back Guarantee?

Yes. There is a 90 Day Money Back Guarantee. If you're not satisfied for any reason with the LOGROBOT tool, by all means, please let us know.

We have never had to issue a refund, but we will if asked. We stand proudly by our product and the time-saving, labor-eliminating, alert reliability services it delivers.


Is LOGROBOT sold on a per server basis?

At the moment, No.  This means, for the price listed for each plan at the bottom of this page, you will be able to monitor an unlimited number of log files on as many UNIX hosts as you need. 


I want to be able to monitor the log files on ALL my UNIX servers

Things you need to do for that to happen:

Place LOGROBOT on ALL your UNIX servers.  Installation is very simple:

  • Copy the LOGROBOT.zip file to each one of the hosts that you have log files on.

  • Unzip the LOGROBOT.zip file, then run the installation command.

Basically, here’s all you have to do on each of your UNIX hosts:

  1. unzip LOGROBOT.zip

  2. InstallAgent.sh     /apps/magent     5666     10.20.30.40     client

Explanation of the parameters:

  • /apps/magent is where LOGROBOT will be installed.

  • 5666 is the TCP port number on which the MASTER server will connect to each remote hosts

  • 10.20.30.40 will be the IP of the MASTER server (the primary monitoring host)

  • Client means the host on which LOGROBOT is being installed is a CLIENT host, not a MASTER host

To install LOGROBOT on the MASTER server, just run this:

  • InstallAgent.sh     /apps/magent     5666     10.20.30.40     master

  • Change the port number and/or IP address to match your environment

Installation Completed!


I want to be able to also VIEW log files on all my hosts from ONE Web Interface

LOGROBOT comes with a PHP Web Interface that enables you to specify which host a log file is on, what TCP port you wish to connect to on that host, and where the log file is located on the host.   The benefit of this feature is so that you DON'T have to manually log in to any server in order to view the contents of the log files on that server. 

This feature basically eliminates the tedious task of having to type passwords repetitively to gain access to several servers.  It eliminates the need to generate tokens or to tamper with ssh config files. None of that is necessary.  If you want to view a particular log file on host x, simply bring up the PHP Web Interface, type in the host name, the location of the log file, what port to connect to, then hit submit!


Can I monitor for multiple strings in a log file instead of searching for them separately?

Yes! If you want to monitor your logs for multiple strings, you can run LOGROBOT this way:

Example:

Monitor log for strings “Error” and “Panic” and “Exception” and “Kernel”

Command:
logrobot autofig /path/to/logfile 60m ‘Error|Panic|Exception|Kernel’ ‘.’ 1 2 –show

Whenever LOGROBOT finds any line that contains any of these strings, it will alert.   Additionally, it will show the exact line(s) found in the log that matched the strings you specified. 

In other words, NO, you do not have to run several instances of LOGROBOT for different strings.  LOGROBOT can monitor them all in one go!


After downloading LOGROBOT, can I submit requests to add custom / personalized features?

Yes.  We usually complete custom requests within 24 to 72 hours of submission.  If your request isn't of an urgent nature, please state so in your email.  NON-Urgent email requests will be completed within 5 business days.  Contact us for more information.


Back to Top


Licenses

LogRobot

Unlimited UNIX Hosts / Servers

Monitor Unlimited Log files on each host!

$99.95  Buy Now (one time payment)

Instant Download!

Contact Us

  • Monitor Your Log Files However You Want

  • Submit Customization Requests Whenever

  • Avoid Writing Several Different log monitoring scripts

  • Avoid dealing with complicated instruction manuals!

  • Use with Cron, Nagios or other Monitoring Applications

  • Receive only Valid Actionable Log Alerts - no false positives!

  • Monitor Entire Directories of Log files with just one Check

  • Monitor Rotated Logs - Never miss a critical log entry!

  • Monitor Dynamic logs without any Additional Configuration

  • Monitor & Alert on Log Inactivity or Unusual Log Patterns

  • Use just ONE tool to monitor ANY log related Statistic!

  • Automate / AutoGenerate Log Check configs in Nagios

    • Eliminate the tediousness of setting up log checks on multiple different log files across several different hosts and servers!

Back to Top

The Automated Download of LOGROBOT will begin within 10 seconds of payment completion. 

Log Checks via Emails

Nagios

Command Line Examples

Questions Ideal Monitoring

Pricing

Graphing

Consultation

Contact Us

Copyright    |    Restrictions    |    Licensed Product    |    Grant of License    |    Warranty    |    License Agreement